Market Sentiment: Insight
What Agents in NY & NJ Are Observing — with Local Snapshots
In 2025, real estate agents across New York and New Jersey are navigating a landscape that’s cautious but far from frozen. Macro-headwinds such as rising interest rates persist, yet pockets of strength, shifting buyer priorities, and local variation are creating opportunity. Below are key trends, followed by county-level snapshots to help you see what’s happening close to home.
Key Trends Agents Are Reporting (Recap)
-
Inventory remains tight — especially for well-priced, well-situated properties.
-
Pricing growth is moderating — upward momentum exists, but buyers have more negotiating power.
-
More frequent price adjustments — especially in suburban or fringe markets.
-
All-cash / investor offers dominate in many competitive segments.
-
Demand is shifting toward homes with better transit access, outdoor space, and flexible layouts.
-
Sentiment and confidence are major drivers — buyers are more hesitant, and marketing, presentation, and responsiveness matter more than ever.
Local Snapshots: NY & NJ Counties and Markets
Below, some recent data that agents are referencing in New York and New Jersey markets. Use this as a benchmark for your own counties.
📍 New York State & NYC Region
-
New York City
-
As of August 2025, the typical (median) home value in NYC is ~$796,000, up ~3.2 % year-over-year. Zillow
-
The rental market remains strong: median asking rent in many parts of NYC has climbed, with some boroughs experiencing ~2–3 % year-over-year gains. Colibri Real Estate School
-
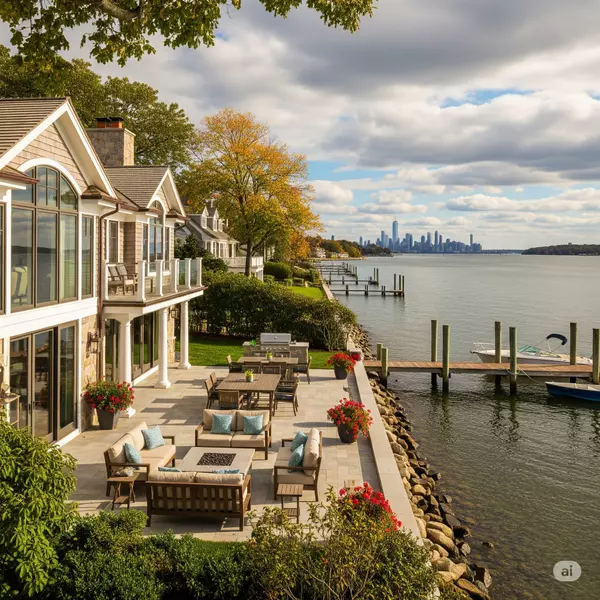
In the luxury segment, Manhattan is seeing outsized activity: sales in the top 5 % have surged, and inventory in that tier is tightening. New York Post
-
Despite some macro headwinds, agencies report that high-quality, well-located assets (especially condos/co-ops in desirable neighborhoods) continue to attract buyers. CBRE+1
-
-
Other NY (Upstate / Non-NYC markets)
-
Some upstate markets (Albany, Rochester, Hudson Valley) are registering stronger growth forecasts (5–6 %) relative to NYC, as affordability drives demand outward. closedbymo.com+1
-
Inventory in many of these regions remains constrained, which supports price resilience even in quieter markets. closedbymo.com
-
📍 New Jersey & Selected Counties
-
Statewide NJ Trends
-
In August 2025, home prices in New Jersey were up ~5.8 % year-over-year, with a median sale price around $584,900. Redfin
-
Listings are climbing: the number of homes for sale grew ~10.7 % compared to a year earlier. Redfin
-
The median value across NJ is in the range of $560,000–$590,000 depending on region. Zillow+1
-
The NJ All-Transactions House Price Index (FHFA) is also trending upward: Q2 2025 index at 921.48 vs prior quarters. FRED
-
-
County / Local Examples
-
Essex County
-
Hudson County
-
Monmouth County
-
Newark (as illustrative urban NJ market)
-
What This Means for Agents & Clients
-
Hyperlocal variation matters more than ever. A 5 % price increase in one county might translate to flat or even slight decline in a neighboring county.
-
Pricing precision is critical. In many local markets, buyers are sensitive—and overpricing even by a few percent can stall a sale.
-
Inventory pressure is easing, but selectively. Some suburban and urban‐adjacent counties are seeing more listings, which gives buyers more choices and more leverage.
-
Time on market is creeping upward. Homes are taking a bit longer to go under contract in many competitive markets compared to earlier in the pandemic cycle.
-
Investor and cash buyer activity will remain strong. Especially in counties closer to major employment hubs or transit lines, where rental demand and redevelopment potential are attractive.
-
Presentation and marketing execution win. Because deal margins are tighter, the difference between average and excellent presentation (photos, staging, responsiveness) is magnified.
Categories
Recent Posts